Halton Real Estate Market October 2025 — Listings, Sales & Prices
Next Read. November 2025 Market Update
With only 7 weeks left in 2025, is our market finally heating up ?!?!
Or is it…???
This is your Halton real estate market October 2025 update, locally focused, plain English – TREBB Data.
Let’s dive into the numbers to see where we are in Halton, where we’re heading and how we’re doing compared to previous years.
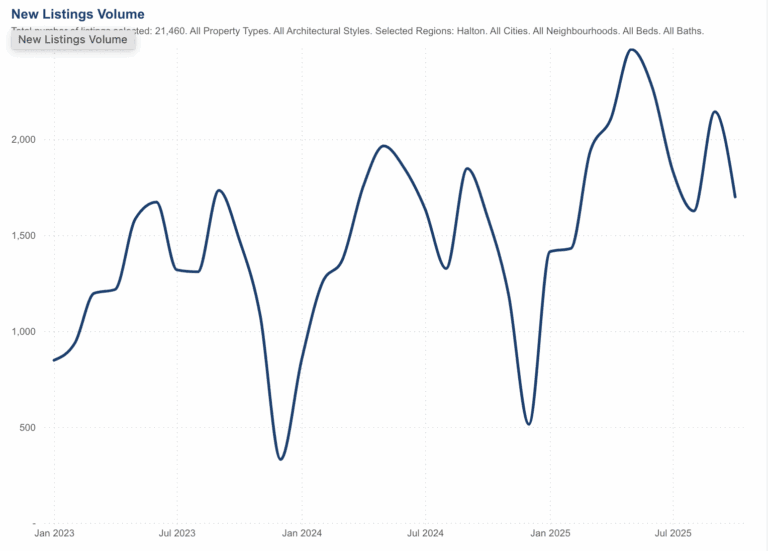
New Listings
It’s a bit of a mixed bag. A dark cloud, but with a silver lining.
Halton Region as a whole saw new listings fall 20% month over month (MoM) – definitely a good thing – slightly offsetting the 30% MoM increase from last month.
That’s still up 6.6% year over year (YoY). The silver lining? The lowest YoY growth in new listings for the last 12 months.
- Burlington posted the largest MoM decline in new listings (-22%) and was essentially flat YoY (-0.08%).
- Halton Hills fell MoM by -17.5%, but had an increase of +15.6% YoY.
- Milton was just below the regional average of -19.4 fewer new listings MoM, and -1.9% fewer YoY.
- Oakville was a mixed bag with -21.2 fewer MoM, but +15.6 more YoY.
There seems to be a good mix of motivation in the market as we’ll see a bit later on.
Some people need to sell as the cost of living increases and the economy continues to stumble. There are many manufacturing and tech jobs in the region, which seem to be some of the hardest hit industries right now.
Others are Boomers who are looking to downsize. This group has no desperate motivation and are happy to hold out until they get their price.
The final group are those who would like to move, but want to know with certainty what they can get for their home, or that it will sell. Again, there isn’t any desperate motivation here and they too will hold out until they find the right buyer.
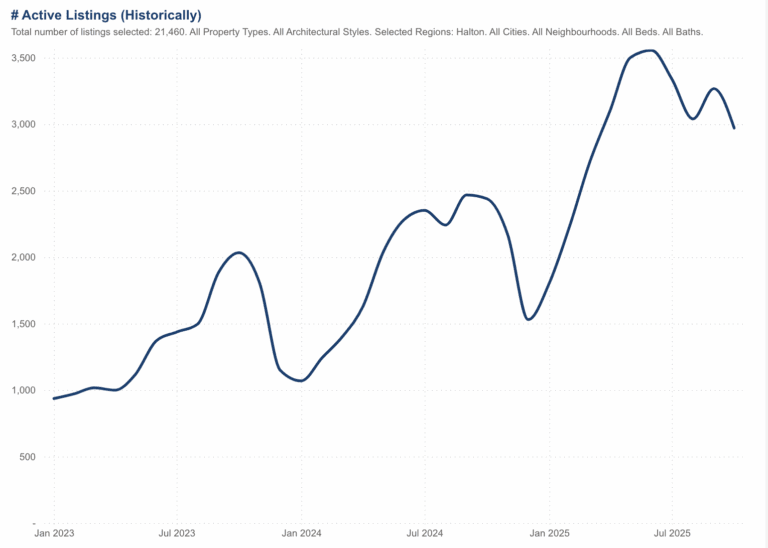
Active Listings
This is the true barometer of the real estate market’s health right now. This is one of the main stats we want to follow to see when we near the bottom.
The story of the last 18 months has been the elevated number of listings. Both a cause of an abnormally high number of new listings coming on the market, and the lack of interest from buyers to participate.
Both of those result in listings sitting on the market, not selling, while new inventory continues at an increasing level.
As it stands, Halton has roughly 80% more listings than the average between 2015-2023.
But, the silver lining is it’s coming down.
Halton saw a -9.1% decline in active listings MoM, but still elevated at 21.8% more than a year ago.
Looking deeper into each municipality shows a similar pattern. Inventory coming down, but still elevated.
- Burlington saw active inventory come down -7.9% MoM, but still up +18% YoY.
- Halton Hills had the largest decrease at -10.5% MoM but also had the largest YoY jump of +25.8% more homes.
- Milton was close with a MoM decline of -10.3%. Yet still up 19.1% YoY.
- Oakville had the lowest decline, at -7.6%. And close to the highest YoY increase at +24.9%.
As mentioned, we need to see active inventory come down before we see prices stabilize. Assuming we don’t have a reversal, and knowing we’re going into a slow holiday season, we’re on the right path but we still have a long way to go.
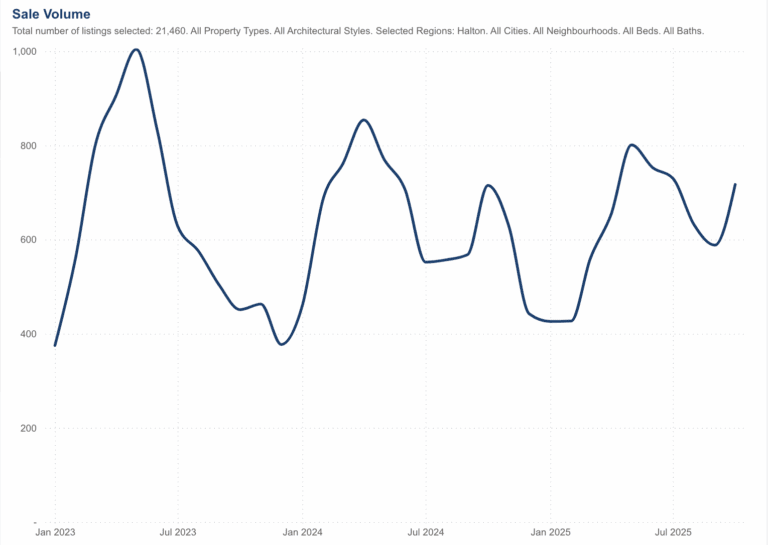
Sales
Sales have been almost absent the past two years, which is half of the reason why active inventory is climbing. Halton typically would see 1200-1300 homes sell in the peak month of every year. But we’ve only seen 800-850 sales in the peak these past two years.
Put another way, approximately 9500 homes typically sell each year, outside pandemic levels. In ’23 and ’24 we averaged about 7500 sales. And in 2025 we might not hit 7000.
But while overall sales are down, October climbed 21.9% from September. The second strongest MoM increase in the last 10 years, next to last year with 25.9. That left YoY growth of only 0.3% but still arguably moving in the right direction given last year was up 58.9% YoY.
- Burlington was up +7.8% MoM but declined from last year’s strong growth by -4.8%.
- Halton Hills followed suit with +6.8% more sales MoM, but a -10% decline from last year.
- Milton had the strongest MoM sales growth at +21.4% and only a +0.6% increase YoY.
- Oakville recorded the strongest sales gain in Halton (+42.6% MoM; +7.8% YoY).
These numbers aren’t anything to write home about, but they do show that buyers are starting to come back to the table.
That could be for multiple reasons, such as consecutive rate decreases, prices coming down and enough time on the sidelines….meaning life has to go on.
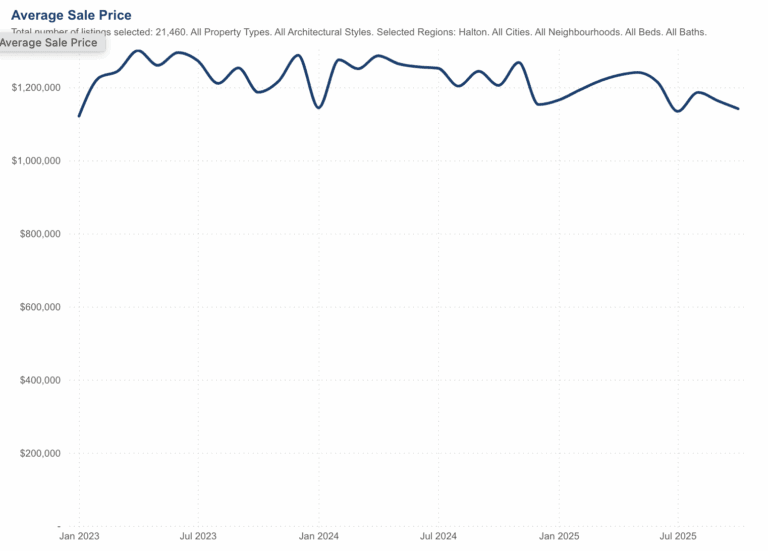
Average Price (Halton Real Estate Market October 2025)
Speaking of prices coming down. We all know that home prices went way too high, too fast. And there are a number of reasons why that happened that I won’t get into here.
But as interest rates climbed, confidence waned and buyers moved to the sidelines, all while new listings surged and inventory climbed that supply-demand imbalance shifted in the buyers’ favour.
The Canadian real estate market has cooled across the country, and Halton is no different.
The average price in Halton slid to $1,141,777 in October. Down -1.8% MoM and -5.3% YoY.
That’s below the year-to-date average in 2025, which sits at $1,189,644; down from $1,344,830 for 2022. Meaning we’re still sliding downward.
- Burlington had a fairly sharp drop of -5.7% MoM and -8.3% YoY as buyers got the upper hand.
- Halton Hills saw a statistical anomaly with a -17.5% drop due to a few large houses selling in September, resulting in an abnormally high average increase. Still, they’re up +2.0% YoY.
- Milton saw the firmest price performance (+2.6% MoM; +2.9% YoY).
- Oakville was mostly flat MoM at -0.9%, but there was a substantial drop of -10.3% YoY.
We talked about this last month and in my market update video as well, but when small towns like Halton Hills have a few large farms or expensive properties sell, it can skew the averages.
In smaller markets like Halton Hills, a few high-ticket rural or farm sales can swing the monthly average; quarter-over-quarter trends (or the benchmark price) provide a smoother read.
This was the case last month when they had a 20+% increase MoM, followed by a -17.5% decrease this month without those large sales.
Interest Rates
As we know, the Bank of Canada (BoC) lowered its overnight interest rate by 0.25% in October. The anticipation of this, in addition to the 0.25% drop in September, marks a downward trend to interest rates that might have given buyers some confidence.
Especially after the continued pause of the summer when most economists, banks and consumers were looking for relief that didn’t come.
With continued rate declines anticipated in 2026, stressed sellers might appreciate the recent easing in rates, with more on the horizon. Which could reduce the number of new listings coming on the market in the coming months.
Keeping in mind that the 2021 5-year fixed renewals are maturing in 2026. If rates are reduced further it will decrease the rate of stress listing as the increase in payments at the current interest rates will be more manageable than those who renewed in the first half of 2025.
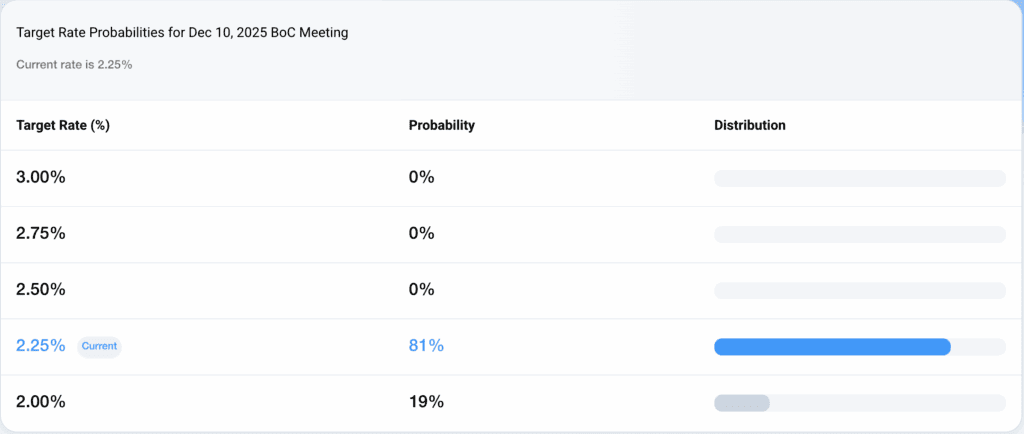
While the market is predicting an 81% probability that the BoC will hold rates as-is in December, there is currently a nearly 60% probability that rates will come down in January.
Source: TRREB MLS® data, October 2025 (residential freehold + condo). MoM = vs September 2025; YoY = vs October 2024.
Summary
Here’s a simple summary of what we’re seeing in Halton right now.
• While new listings are still well above average, they’re decreasing from the extremes we’ve seen throughout 2025.
• Active listings are also coming down as more buyers buy and fewer homes are coming on the market. But Terminations and Expirations are still well above historic norms.
• Sales are finally increasing as interest rates come down, but the economy is still very soft, and the cost of living is still higher than most are comfortable with.
• Average price is still sliding downwards. Halton’s two largest municipalities saw year over year declines in average price both MoM and YoY. While Milton was the only town to see positive numbers both monthly and annually, albeit marginally.
• Interest rates are coming down, fueling buyer confidence and relieving some stress from many sellers.
The market is really cool right now, with some minor pockets of lukewarm.
But there are some excellent opportunities right now for those who are in the market to purchase in the next few months. Premium lots are selling without a premium price tag.
Homes that need a bit of updating offer a ton of value for lot size and price per square foot.
These are things that will be highly sought after when the market returns to normal.
Remember, the media is looking for eyeballs, and nothing attracts attention like fear and negativity. Further, they don’t report on local markets and hyperlocal segments. They talk in generalizations and broad numbers.
Speaking to a local pro on what you’re looking for and what’s really happening locally will set you apart.
As always, I hope you found this useful!
Andrew
